The t-distribution is a type of probability distribution used in statistics to estimate population parameters when the sample size is small or when the population standard deviation is unknown. It is a widely used distribution in hypothesis testing, confidence interval estimation, and other statistical inference techniques.
In this article, we will discuss what the t-distribution is, how it works, and how to use it.
What Is T-Distribution?
The t-distribution, also known as the Student’s t-distribution, is a probability distribution that is used to estimate the population mean when the sample size is small or when the population standard deviation is unknown. The distribution was first introduced by William Gosset in 1908, who used the pen name “Student” to keep his employer’s name, Guinness Brewery, anonymous.
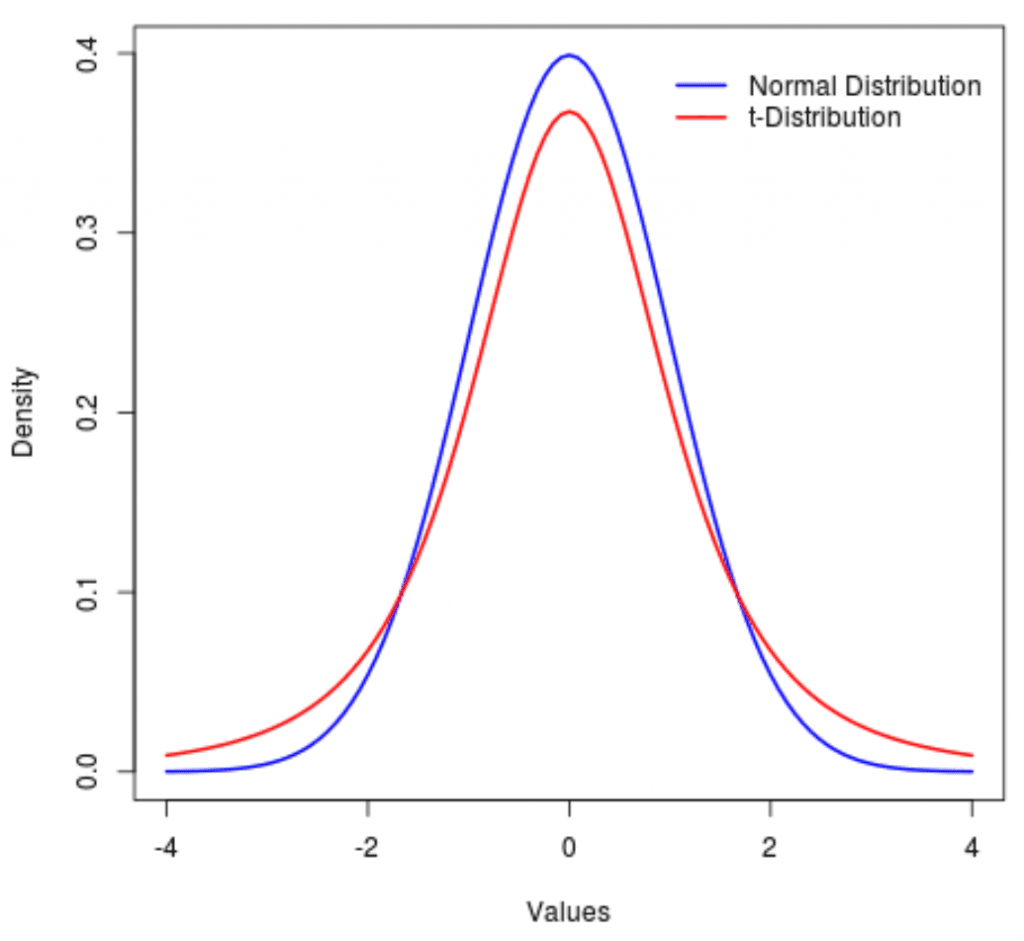
The t-distribution is similar to the standard normal distribution, but it has heavier tails and a flatter peak. This is because the t-distribution takes into account the uncertainty of the sample standard deviation when estimating the population mean. As the sample size increases, the t-distribution approaches the standard normal distribution.
The t-distribution has a parameter known as the degrees of freedom (df), which is the number of independent observations used to calculate the sample mean. The degrees of freedom determines the shape of the t-distribution.
How Does the T-Distribution Work?
The t-distribution is used to estimate the population mean when the sample size is small or when the population standard deviation is unknown. In these situations, the sample mean can be used as an estimate of the population mean, but the exact value of the population mean is unknown.
The t-distribution takes into account the uncertainty of the sample mean by using a standard error, which is the standard deviation of the sampling distribution of the sample mean. The standard error is calculated using the sample standard deviation and the sample size.
The t-distribution is used in hypothesis testing and confidence interval estimation. Hypothesis testing is a statistical technique used to test a hypothesis about a population parameter based on a sample of data. Confidence interval estimation is a technique used to estimate the range of values within which the true population parameter is likely to lie with a certain level of confidence.
How to Use the T-Distribution?
To use the t-distribution, you need to know the degrees of freedom and the significance level. The degrees of freedom depend on the sample size and are equal to the sample size minus one (df = n – 1).
The significance level is the probability of rejecting the null hypothesis when it is true. The most commonly used significance level is 0.05, which corresponds to a 95% confidence level.
To use the t-distribution for hypothesis testing, you need to follow these steps:
- State the null hypothesis and the alternative hypothesis.
- Choose the significance level.
- Calculate the test statistic using the t-distribution.
- Determine the critical value using the t-distribution and the degrees of freedom.
- Compare the test statistic to the critical value.
- Make a decision and interpret the results.
To use the t-distribution for confidence interval estimation, you need to follow these steps:
- Calculate the sample mean and the sample standard deviation.
- Calculate the standard error using the sample standard deviation and the sample size.
- Determine the degrees of freedom using the sample size.
- Determine the critical value using the t-distribution and the degrees of freedom and the desired confidence level.
- Calculate the confidence interval using the sample mean, the standard error, and the critical value.
Conclusion
The t-distribution is a probability distribution used to estimate the population mean when the sample size is small or when the population standard deviation is unknown. It is a widely used distribution in hypothesis testing, and confidence interval estimation.